Plandroid - Graphical Air Conditioning Design and Quoting Software
Plandroid Help Documentation
The menu item Tools -> Options launches the Options dialog box. Here you can control many settings to fine tune how you would like Plandroid to work for you. There is a dedicated Options tab for each of the Design, Costing, and Report pages, plus a general options tab.
General Options
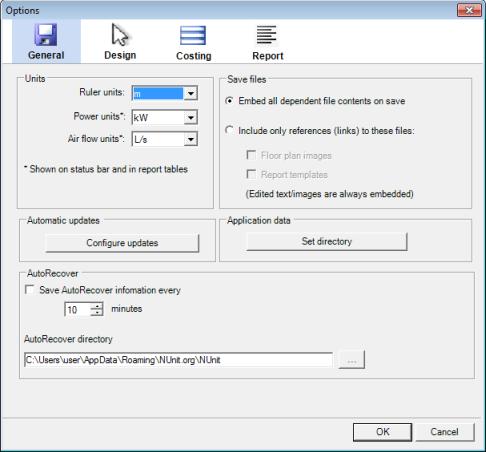 |
In the General options page, you can set your preferred system of units for the Design tab ruler, the power calculations and the air flow display. The ruler units are also the length units used for reporting properties such as duct lengths and outlet face flow velocities (when you right click on a part and select Properties). The power units and air flow units determine the units shown in the status bar and in any report tables you are using, as well as flow properties.
The Automatic Updates Configure Updates button launches a dialog where you can specify how frequently you wish the program to automatically check for updates, and other update options. (You can check for updates immediately using the menu item Help -> Check for Updates).
The Application Data Set Directory lets you manually set the location of the program's application data, which includes the catalog files you are using, your report templates, your customer database, and other information. This can be useful if you want to store your application data on a remote server, for example, or in a common location that is regularly backed up. If you use this option, the program will still keep an updated copy of your settings in its default Application Data location. It will use the backup copy if you lose your connection with your custom location, which could happen if your custom location is on a remote drive and your network is down or you are travelling with your computer. In this case, Plandroid will warn you if you try to modify any information that is stored in your local Application Data directory, as any changes you make when using your backup data will be lost when you reconnect to your custom location. Use this option with some care, as the application data is specific to each Plandroid version. If you are sharing your application data you will need to make sure that all of your users are using the same Plandroid version, and that they all update to new releases at the same time. Otherwise you could get unexpected results.
In the Save files panel you can set how you would like Plandroid to save its native files. Each design may be built on one or more plan image files, plus a report template file. These may be large files, so you can choose if you would like to embed them in the Plandroid save file or not. If you embed them, all the information needed to restore the state of the program will be in the save file. This is very useful if you intend to send your Plandroid save file to someone else, for example, but can result in very large files. If you prefer to keep your save files small, then you can instead include links to your floor plan images or unedited report templates. That means the program will remember where you had those files when you were doing your design, and will look there again if you load the save file. If you have edited the text in your report template, then the program will always save the changed text in your save file. Likewise if you have edited a floor plan image (with the Plan -> Cut or Crop tools) that is in a raster format (any format except PDF, plus non-vector PDF images) those images will also be embedded. Be aware that if you move or change a linked file, or try to open your save file on a different computer which does not have those files, the program will not be able to restore its previous state correctly.
The AutoRecover settings control how the program creates and keeps automatic backup files. You can set how often the program saves a backup file, and the directory where the files are saved. During an automatic backup save, the program will briefly pause. If you set a shorter autorecover period, the program will save your data more often, but you will also have a brief delay more often. The autorecover function will handle running more than one instance of the program on your computer at a time.
If you are working on a network, it is strongly recommended to use a local AutoRecover directory (such as on your C: drive), and not a directory on your remote network. The AutoRecover function does not, of course, replace the need for you to have your own regular backup procedures in place.
Design Options
The Design options page lets you tune how the application behaves when you are in the Design Page. These options are somewhat complex and are spread out over a number of tabs.
Labels
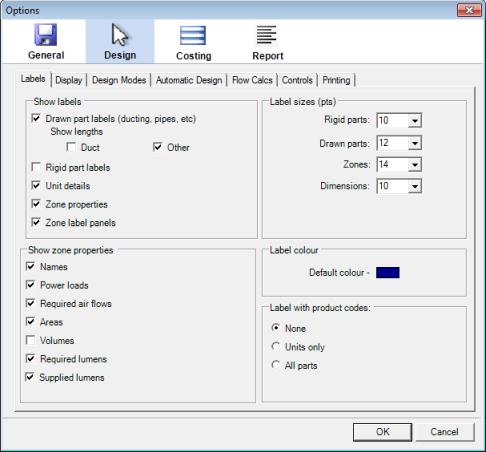 |
The labels tab controls which items should be labelled in your design, and the default sizes and colour for the labels. Note that each label can also be turned on or off individually, which overrides this setting, and if an item is selected, its labels are always shown. The default Show Labels property can also be set for each individual part in the Parts catalog using the catalog context menu. The Show zone properties panel has controls for displaying the names, power loads, air flow loads, areas or volumes of selected zones in the status bar. The Show labels -> Zone properties setting determines if the selected properties are shown as a label on each zone.
The label sizes (in points) are scaled such that each font point represents 20mm on the scaled plan.
The Label with product codes controls let you use the product codes as labels directly instead of the part's normal description, if that is clearer for you. The labels for units can be controlled separately. The labels are changed only in the Parts catalog, and therefore on any parts subsequently added, and not on any existing parts in your design.
Display
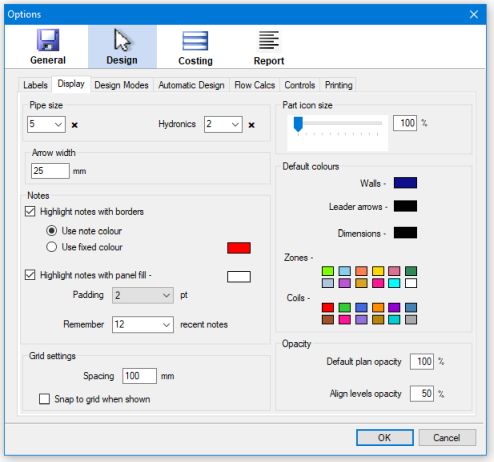 |
The Display tab controls various parameters that control how the design is coloured and displayed. You can scale the part icon sizes from 100% up to 200% of their physical size, to improve their visibility. (Use this with caution if you are placing rigid parts whose lengths are important, such as rigid pipe fittings, as their lengths will also be scaled. Also, note that changing the scaling may disrupt the alignment of your rigid parts.) As pipes are generally very thin when drawn to scale, they have their own separate scaling controls. The Arrow Width setting controls both the default Note leader arrow width and the default Dimension arrow width.
Notes can be highlighted by default with either a bounding box, and / or with a background panel fill. (Individual notes can have their own individual highlighting style defined as well).
The grid snap-to spacing can be set here, as well as the default colours to use for various design items: walls, leader arrows, and dimensions. Plus you can define the sequence of colours that are used for the zone colouring. The Opacity settings control the default levels of opacity (transparency) to use for drawing the floor plan images. (Note that applying opacity to a plan image may result in a noticeable reduction in performance, especially for large image files). The Align levels opacity is the opacity level to use when overlaying a lower level onto the current level image when using the Align levels Plan tool.
Design Modes
The Design Modes tab shows the settings that are used for each mode: Refrigerated, Evaporative, Heating, Hydronics, Venturi,
or the Lighting mode. The settings include the method used
to calculate the air flow required for each zone, and the air flow velocity limits used for sizing the required ductwork
in the Automatic Design ( ) tool or the Auto-size Ducts
tool (
) tool or the Auto-size Ducts
tool ( ). The flow limits are defined for each different
position in the branch tree - the main trunk being duct coming directly from the unit or supply starter, the final duct
is duct that leads directly to an outlet, and a branch being anything in between.
). The flow limits are defined for each different
position in the branch tree - the main trunk being duct coming directly from the unit or supply starter, the final duct
is duct that leads directly to an outlet, and a branch being anything in between.
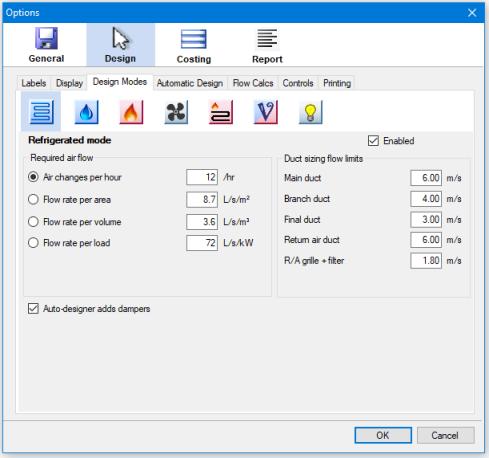 |
The active design mode is selected on the Design Loads tool tab. You can use the Enabled checkbox to control which modes are shown in that tool, so that ones you don't use do not appear. The venturi and lighting design modes are licensed separately, and require a specific licence module before they can be enabled.
You can also control if the automatic designer automatically adds dampers for each switchable zone, based on the current design mode. Continuous (constant) zones do not have dampers added.
Automatic Design
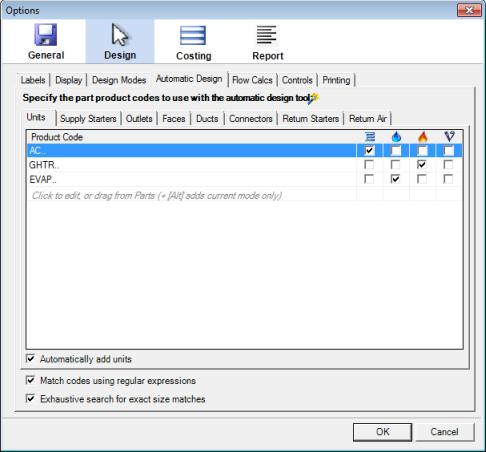 |
The Automatic Design settings specify the product codes of the preferred parts to add to your design when you use the Automatic Design
toolbar button (). This tool will create a fully sized design completely
automatically. You can then modify the design manually to satisfy your requirements.
You can specify which parts can be used in which design modes with a checkbox for each mode. Suitable parts are chosen in the order that they appear in the
list, for example if you have Y-pieces listed above Collar Ys, and both have the sizes required, then the Y-piece will be used. Parts can be
dragged within the list to reorder them.
The program will search first from this list for the required parts to create your design. If no suitable part is found here, the program will next search your catalog Favourites. If still no appropriate part has been found, then all of your loaded parts are searched. See the Automatic design section for more details.
You can edit this list by hand, or drag-and-drop parts from the Parts catalog directly into these lists. Each list will only accept the correct type of part. If you cannot drop a part into a specific list, it is the wrong sort of part for that function. Hold down the [Alt] key when adding a new definition or dropping a part into the list to add it with only the current design mode checked for that part - otherwise by default it will be added with all design modes checked.
Per-Component Control
Each component-type tab has its own Automatically add check box for providing fine control over which types of components are added. However, note that some types of components are contingent on other types being added first. For example, if you do not automatically add a unit, then no starters or ductwork will be added either, only outlets and (possibly) outlet faces.
Regular Expression Matching
The Match codes using regular expressions option allows you to use the powerful pattern matching system known as regular expressions (or sometimes just regex) to match the product codes to use. If this option is not selected, parts must match the listed product codes exactly to be used. By using regular expressions you don't need to enter row after row of part codes. Instead you can use only one or two lines to match a wide range of part codes with exact precision.
Regular expressions are too broad a subject to cover here in detail; there are many on-line tutorials on the topic. A few examples will suffice to demonstrate how they can be used:
- COLY - matches any part code containing the string "COLY" anywhere
- COLY|BTO - matches any code containing either "COLY" or "BTO" anywhere
- ^COLY - matches any code beginning with the string "COLY"
- ^D?BTO - matches any code beginning with 0 or 1 occurrence of "D" followed by "BTO"
- ^COLY. - matches any code beginning with "COLY" and then followed by any one character
- ^COLY...... - matches any code beginning with "COLY" followed by any 6 characters
- ^COLY.{6} - also matches any code beginning with "COLY" followed by any 6 characters
- ^COLY.{6}$ - matches any code beginning with "COLY", having exactly 6 characters, and then ending
- ^COLY.*Z - matches any code beginning with "COLY", then having any number of characters, followed by a "Z"
- COLY[0-9]{6} - matches any code containing "COLY" followed by 6 numerical digits
- COLY[0-9]{4,6} - matches any code containing "COLY" followed by at least 4 but no more than 6 digits
- COLY([1-6][05]){3} - matches any code containing "COLY" followed by the digit combinations 1 to 6 followed by 0 or 5, with the digit pairs repeated 3 times
Exhaustive Part Searches
The checkbox Exhaustive search for exact size matches determines how strictly the program should keep to the specified parts list. If this is not checked, the program will try to add reducers where necessary to the parts in the preferred parts lists to match the outlet sizes required. This has the effect of keeping more closely to the parts on the preferred parts lists and the Favourites. If it is checked, the program will try to keep searching for an exact size match if it can't find one in the given lists, even if that means looking through the entire loaded catalog. It will only add a reducer as a last resort if no exact sizes can be found anywhere. When this option is checked, you will tend to get more parts used that are not on the preferred parts lists.
Flow Calcs
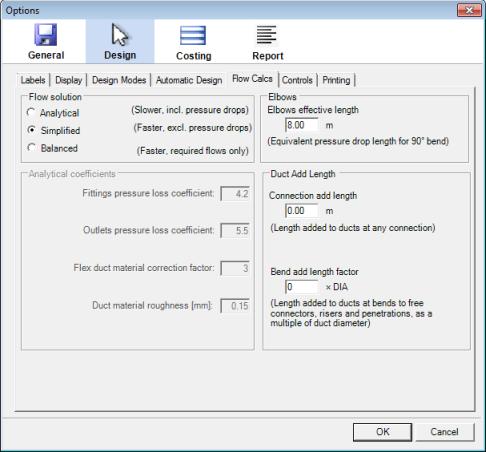 |
The Flow Calcs tab shows the calculation parameters that are used when you analyse the air flows in your duct
layout using the Solve Air Flows tool ( ).
You can specify to use a full analytical solution which calculates the air flows according to the pressure drops in
the ducts and connectors, or to use a simplified solution which ignores those pressure losses. The analytical solution
will give more accurate results, but is significantly more computationally intensive and is therefore slower. The
simplified solver allocates the unit's airflow in proportion to the duct outlet areas in each branch. This ignores
many factors that will influence the actual flows, but can be solved much more quickly. The various parameters required
for the analytical calculations can be set in this tab, including separate pressure loss coefficients for the fittings
and the outlets. The Open Face Fraction defines how much of the outlets'
faces are obscured by deflector vanes, which influences the resulting air flow velocities at those outlets.
The flexible duct material correction factor is the additional pressure loss due to the duct material being fully
extended flexible duct instead of rigid duct. The duct material's surface roughness can be specified here, which also influences the
flow results. The same roughness value is used for rigid and flexible ducting.
).
You can specify to use a full analytical solution which calculates the air flows according to the pressure drops in
the ducts and connectors, or to use a simplified solution which ignores those pressure losses. The analytical solution
will give more accurate results, but is significantly more computationally intensive and is therefore slower. The
simplified solver allocates the unit's airflow in proportion to the duct outlet areas in each branch. This ignores
many factors that will influence the actual flows, but can be solved much more quickly. The various parameters required
for the analytical calculations can be set in this tab, including separate pressure loss coefficients for the fittings
and the outlets. The Open Face Fraction defines how much of the outlets'
faces are obscured by deflector vanes, which influences the resulting air flow velocities at those outlets.
The flexible duct material correction factor is the additional pressure loss due to the duct material being fully
extended flexible duct instead of rigid duct. The duct material's surface roughness can be specified here, which also influences the
flow results. The same roughness value is used for rigid and flexible ducting.
The air flow is also solved when you open the Load Zones table with the Toggle Zones Table tool
( ), to calculate the supplied air. You can investigate
the resultant flows and face velocities with the Part context menu item Properties -> Air Flow and
Properties -> Face Flow Velocity.
), to calculate the supplied air. You can investigate
the resultant flows and face velocities with the Part context menu item Properties -> Air Flow and
Properties -> Face Flow Velocity.
Elbows
Duct rise points and penetrations both have implied elbows, where the ducting is bent through 90°. In calculating flows, these bends cause a pressure drop, which is accounted for by specifying an effective length of duct that would have the same drop under the current flow conditions. The pressure drop in an elbow may be the equivalent of 3 to 12 m (10 to 40 ft) of straight duct, but could be as high as 20 m (65 ft). The effective length of the duct elbows is specified here.
Duct Add Length
Additional lengths of duct can be added to account for the extra lengths required when connecting a duct to any connector, or bending to a "gooseneck" connection, riser, or penetration. The two lengths are added together. The bending add length factor is specified as a multiplier of the duct diameter used, so that wider ducts require more bending length. The additional lengths affect the lengths reported in the Costing page and the lengths used in any calculations, but are not reflected in the drawn duct length markers.
Controls
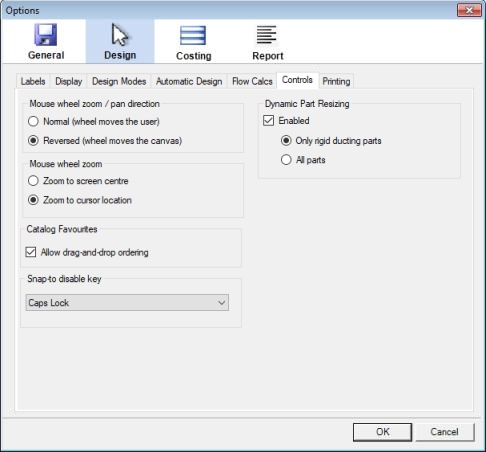 |
These controls specify the behaviour of the mouse wheel when zooming, and also let you turn the catalog favourites (Design -> Parts -> Favourites) reordering feature on and off.
Snap-to
The Snap-to control setting lets you set one of the lockable keys ([Caps Lock], [Num Lock], or [Scroll Lock]) to toggle the effect of using the [Ctrl] key for snap-to. This is, locking the chosen key will stop any snap-to, while holding the [Ctrl] key in this mode will again activate snap-to while it is held down.
Dynamic Part Resizing
The Dynamic Part Resizing controls determine if the parts you are manipulating in the canvas will automatically resize themselves as you move them near other parts. When this option is enabled, a part that is close enough to snap to another part will resize itself if that is required to make the connection. This can save time as you have to go back to the catalog to choose a differently sized part less often.
Printing
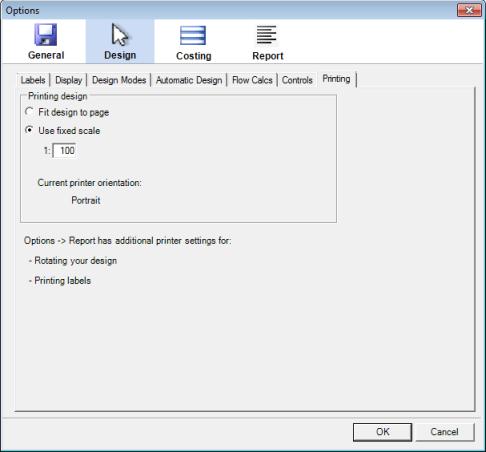 |
This tab contains the controls for printing your design via the menu item File -> Print Design.. You can select the printing scale to use when printing the design. You can choose to fit the design to the page, or you can choose to print at any scale you specify (most common is 1:100). If you print at a fixed scale, the design may not entirely fit on the page, depending on the scale, the size of your diagram and the paper size you are printing on. Note that the Options -> Report tab also has settings that are used to determine what is printed to a design. On that tab you specify if you want to show labels, zones etc. when printing.
The option Show page borders will draw the current printing borders on the design canvas, so you can see directly what your layout will be like. The option Print page borders will also print those borders when you print your design to the printer. The resulting border positions depend on your printer page settings (accessible from the menu item File -> Page Setup), the printing fit/scale options you have chosen, and the design diagram layout options you have selected from the Report Options page. Parts which are neither printed nor drawn to the Report diagram do not affect the print page borders.
Costing Options
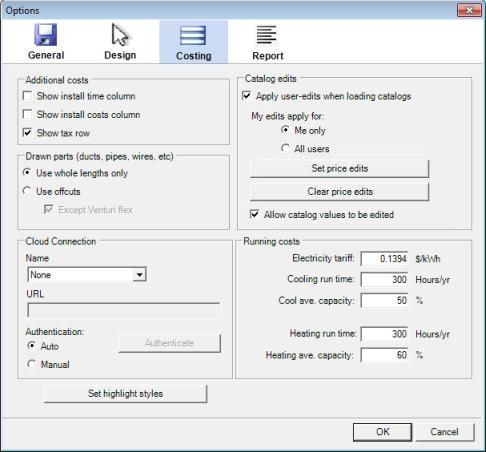 |
Plandroid also allows you to include the labour costs of installing your design in your costing estimates. You can do this by checking either the Show install time column or the Show install costs column items on the Costing options tab. If you show the install time column, you will be presented with a time estimate (in minutes) of how long it should take to install each part in your design. The program will add these times up, and allow you to enter a labour cost (in cost per minute) to calculate the total labour cost. Alternatively, if you prefer to work in fixed installation costs for each part, you can choose to show the install costs column which will likewise add the fixed installation labour costs to your costing. You can edit both the time and the fixed costs values to suit yourself. Note that although you can show both the install time and install costs columns at the same time, if you do this the costs shown will not be added to your total cost, to avoid labour costs being counted twice. (See the Costing page entry for additional information on labour costs.) You can also use the Show tax row option to display a taxation row. Entering a value in the Modifier field of this row will add that percentage to the total cost.
You can specify in the Drawn parts panel how you treat parts which come in unit lengths (Drawn parts), such as ducting, piping, wiring, and line grilles. If you select Use offcuts, then the program will try to use any left over material lengths where they are long enough to be reused without joining the offcuts themselves together, trying to reduce the material costs. If you select Use whole lengths only then you will be using a whole unit length every time you require even a partial length of material, but saving the work of cutting pieces. The Venturi design mode can be an exception, in that you can choose to use offcuts for everything except flex ducts. With this option, each flex duct length will be kept whole, even though the foam duct may be cut.
The Cloud Connection settings are required if you want to connect to a SimPRO server, or (for Climat users), to the Climat server. This allows you to upload your parts take-off list directly to the web-based quote and job management system. Once you have entered the URL (internet address) of the server to use, the Cloud tools will become active. You need to authenticate (log in to your account) periodically to keep the connection secure - normally every seven days. The Authenticate button lets you do that immediately, or the program will prompt you when it is required. For SimPRO, authentication requires the transfer of a code string between web pages. Automatic authentication will try to transfer your code for you and is normally the quickest and easiest method. Manual authentication requires you to perform the code copy-and-paste process yourself, which is somewhat clumsy, but shows you the full process. The authentication method is not relevant for Climat users.
The Catalog edits panel controls if the catalog values are allowed to be edited by the user or not, and if any edits that have already been made should be applied when the catalog is read in (see Catalogs for more information on editing catalogs). Catalog edits can be applied for each user individually (if you want to keep your edits private), or you can share your edits with all users of your computer by choosing the global setting. You can use the Set Price Edits button to add or select different price edit files, each one defining a different pricing scheme. This allows you to use different pricing for different types of customers, for example. Note that the Set Price Edits button shows you a different directory, and therefore a different set of price edit files, depending on if you have chosen the private or the global edits setting. You can also clear all the edits you have made to the catalogs with the Clear Price Edits button. This will clear the default price edits file corresponding to your current edits setting, but won't affect any other custom price edits files you have added.
The Running costs panel lets you set the electricity tariff and annual running times for calculating the cost of running units. The cooling and heating costs are calculated with the EER or AEER, and COP or ACOP performance data (where available) for each unit respectively. These figures can be inserted into your Report as insert items.
Report Options
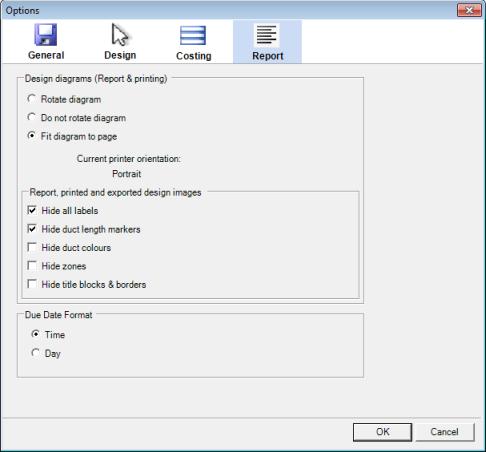 |
The report options control the same options that are available from the Report -> Settings tab. These options control the orientation of your design diagram in your report, and what details are shown on it. The Design diagram rotation controls determine the image orientation in the report, in any exported images (from File -> Export -> Design as Image File), and also when printing the design using the menu item File -> Print Design.
The Due date format used can be set to show either the time (e.g. 2020-07-01 09:00 AM) or the day with AM/PM (e.g. 2020-07-01 Wed AM). This format is used in many places in the program, not only in the Report but also on the Customer page and in order email texts - where ever the due date is used.
The next section describes the Catalog file structure.